
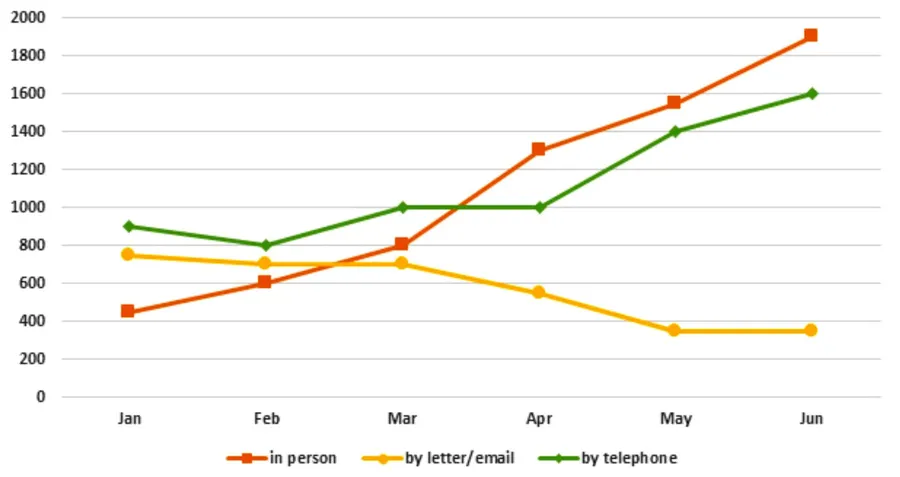
The number of enquiries received by the Tourist…
"The graph below shows the number of enquiries received by the Tourist Information Office in one city over a six-month period in 2011."
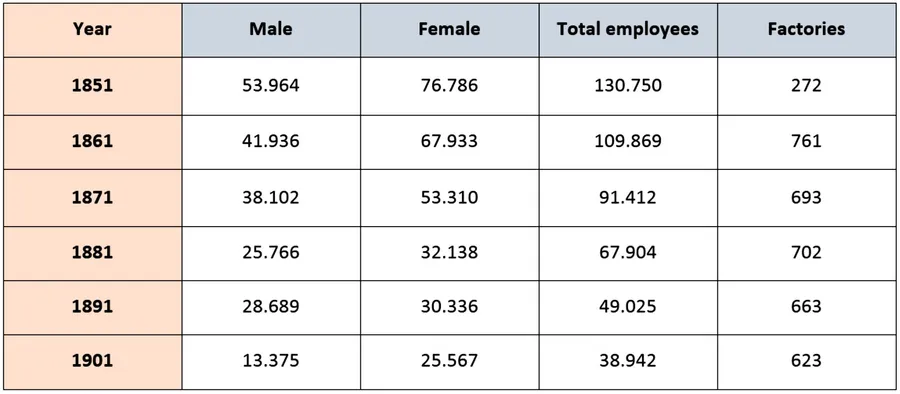
The number of employees and factories producing silk…
"The table shows the number of employees and factories producing silk in England and Wales between 1851 and 1901."
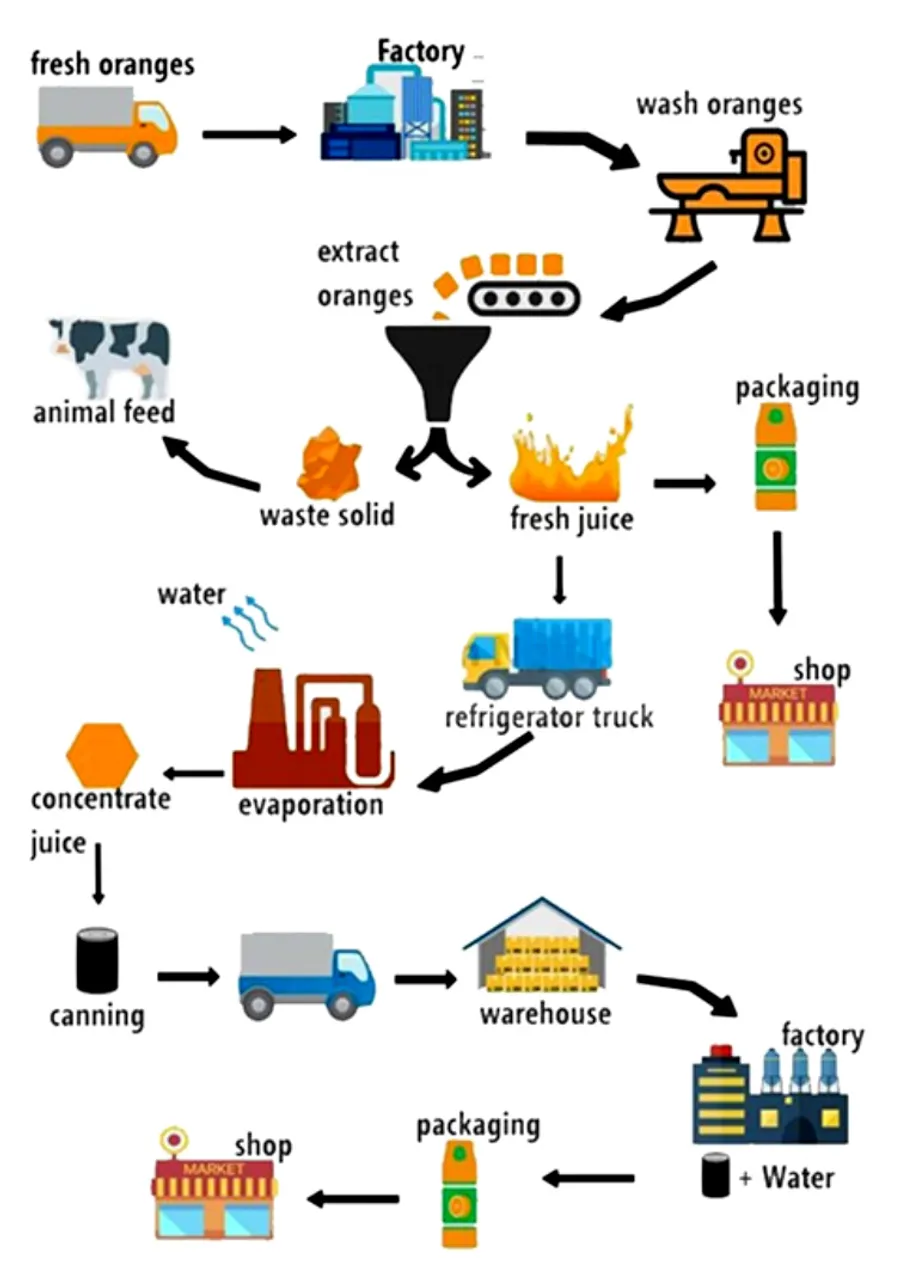
How orange juice is produced.
"The diagram below shows how orange juice is produced."
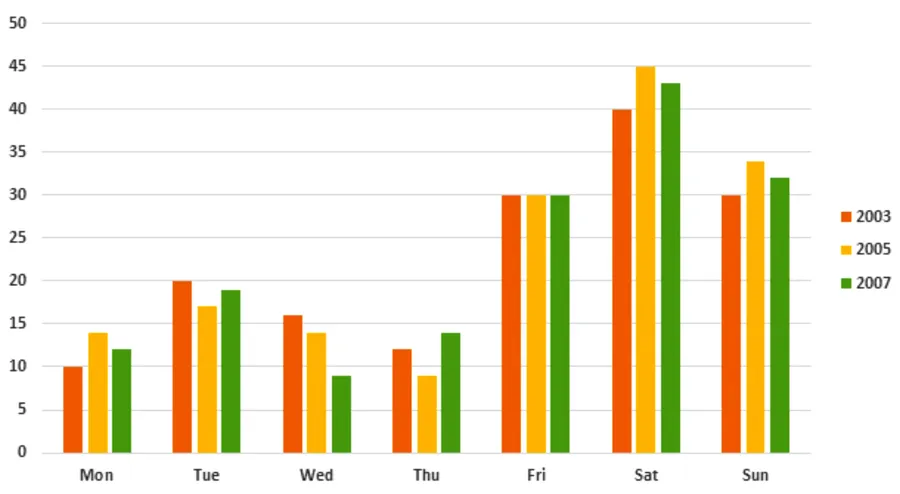
The percentage of people going to cinemas in…
"The bar shows the percentage of people going to cinemas in one European country on different days."
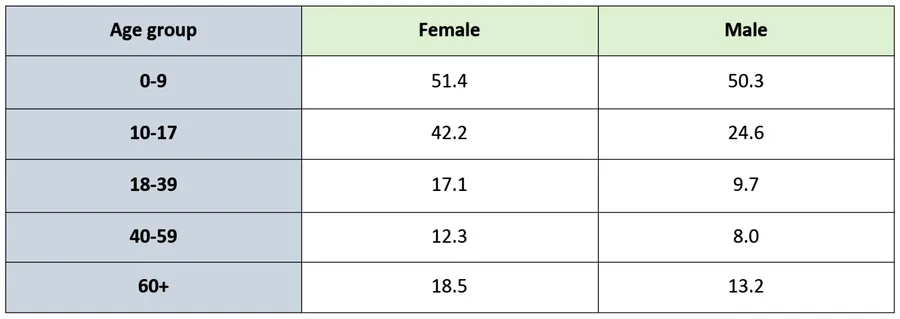
The percentages of the population by age groups…
"The table below shows the percentages of the population by age groups in one town who rode bicycles in 2011."
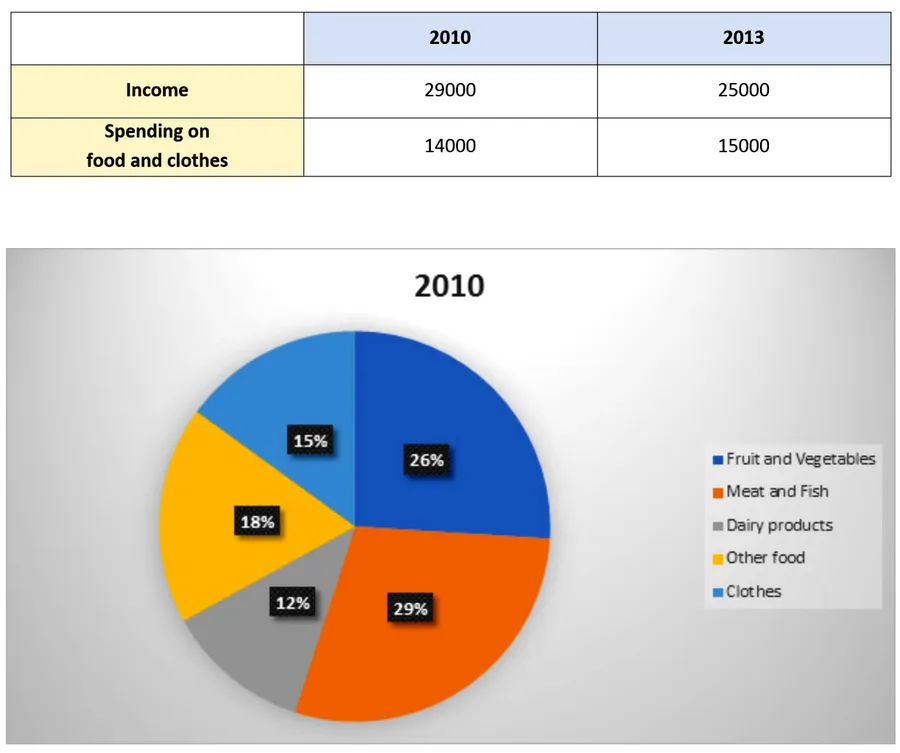
Average income and spending on…
"The pictures show information about average income and spending on food and clothes by an average family in a city in the UK."

The results of a survey conducted by a…
"The pie charts show the results of a survey conducted by a university on the opinions of full-time and part-time students about its services."
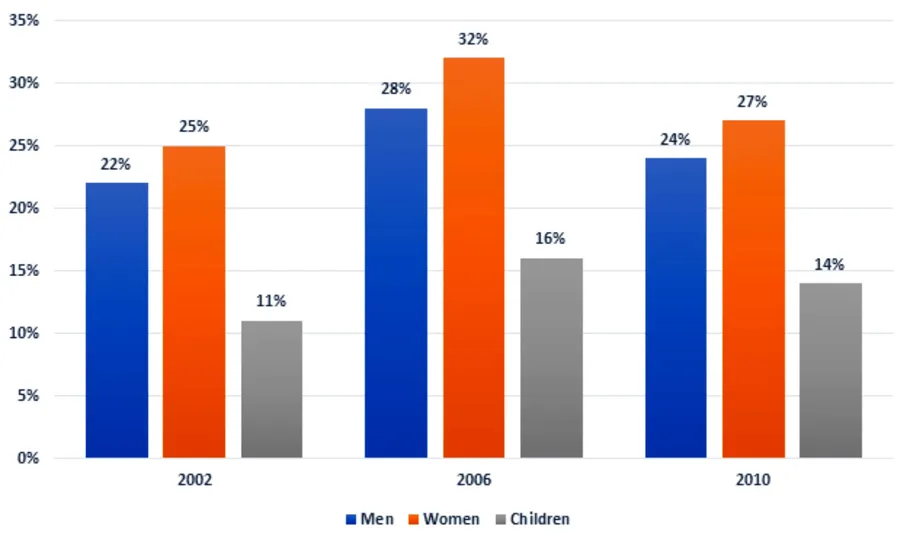
The percentage of the population in the UK…
"The chart below shows the percentage of the population in the UK who consumed the recommended daily amount of fruit and vegetables in 2002, 2006 and 2010."
other
""
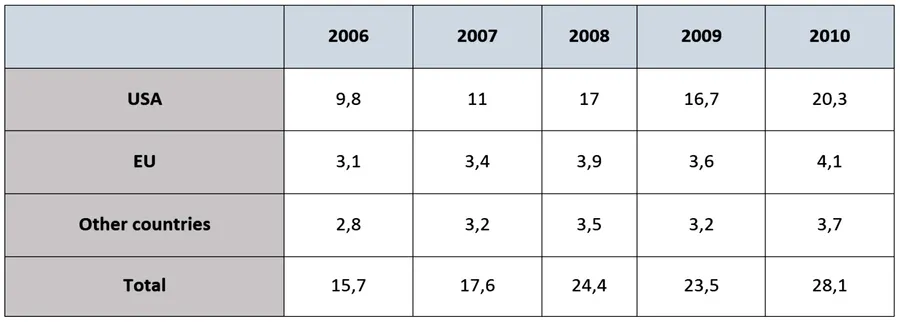
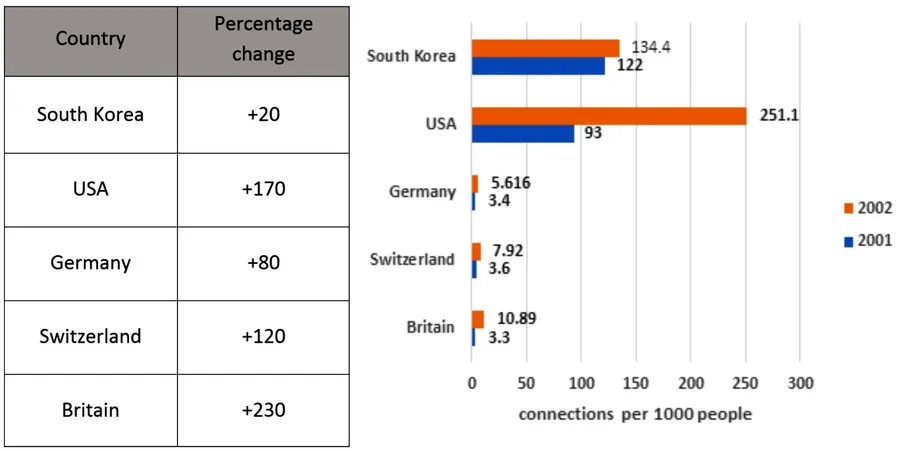
The amount of money given to developing countries…
"The table shows the amount of money given to developing countries by the USA, EU countries and other countries from 2006 to 2010 (Figures are in millions of dollars)."
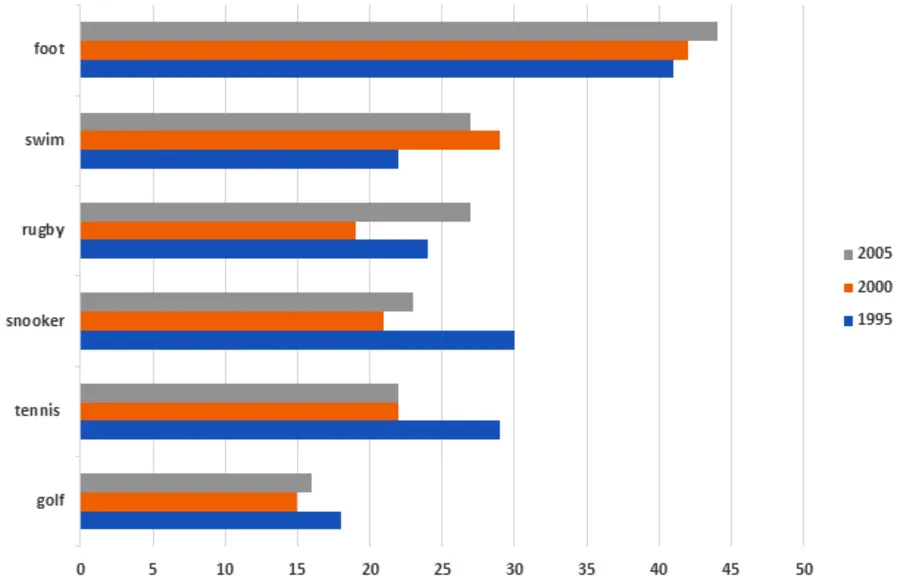
The proportion of people in a UK survey…
"The chart shows the proportion of people in a UK survey carried out in three different years who said they were interested in certain sports."
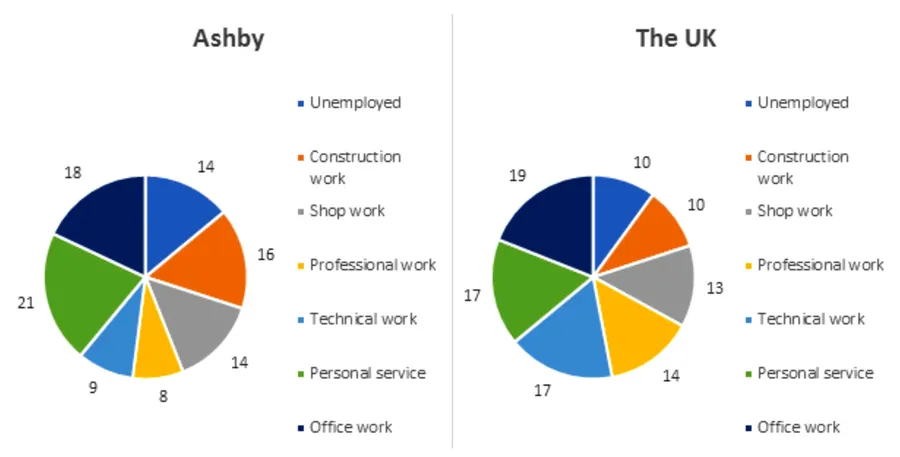
The percentage of people aged 23-65 in different…
"The charts below show the percentage of people aged 23-65 in different occupations in one UK town (Ashby) and in the UK as a whole in 2008."
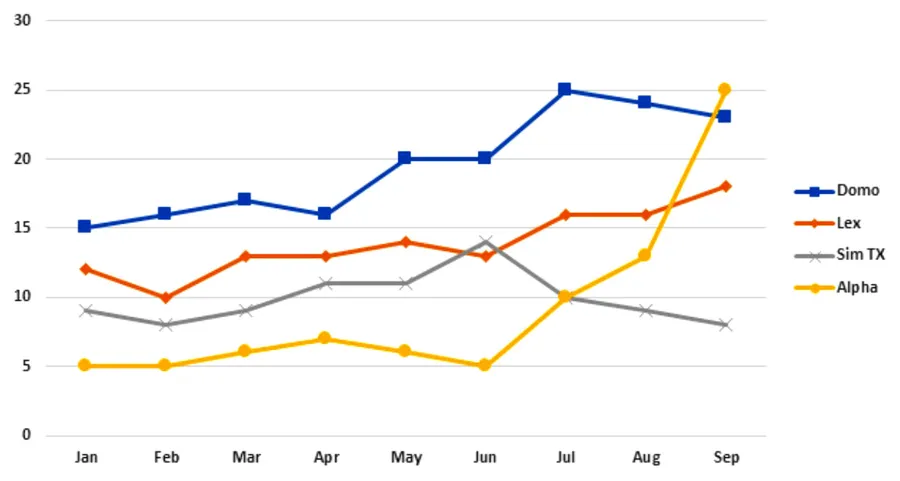
The average cost of monthly contract for four…
"The chart below shows the average cost of monthly contract for four different mobile (cell phones) in a European country from January to September 2002, measured in euro."
mix
""
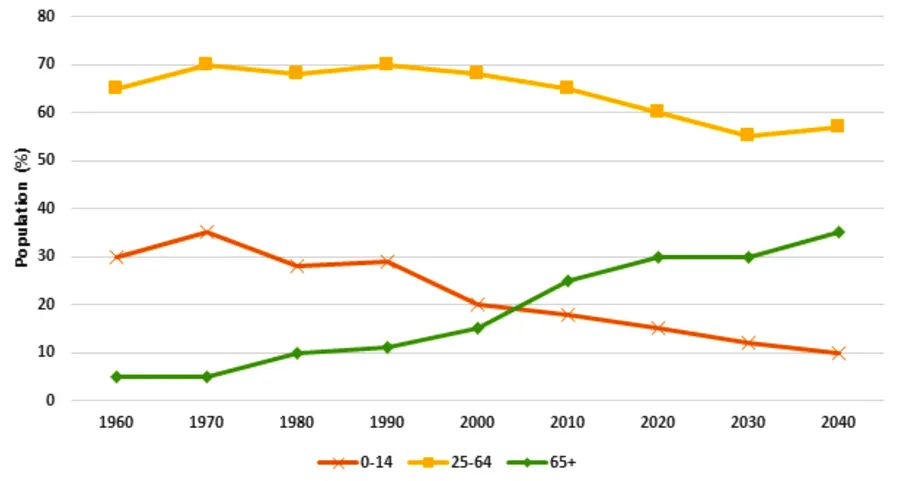
The Japan’s population by age groups starting…
"The chart below shows the Japan’s population by age groups starting in 1960 and including a forecast to 2040."
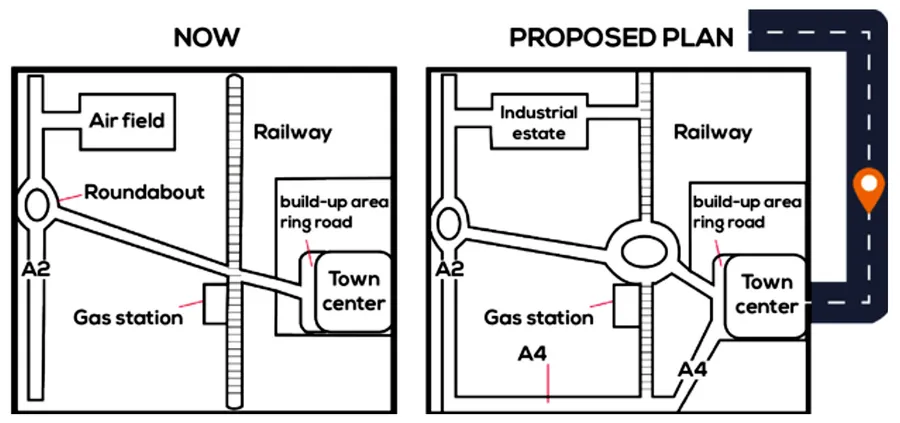
Hunderstone town at present and a proposed plan…
"The maps below show Hunderstone town at present and a proposed plan for it."